
![]()
![]()
MMM (Marketing Mix Modeling) depends on many complex
(non-linear) effects. (To access a
discussion of how Marketing Mix Modeling works, click here MMM.) While
the process of Marketing Mix Models is based on looking for simple trends
within a very complex system, if we oversimply our models will not be accurate
enough and will miss important dynamics.
The major non-linear marketing effect is ad stock, which is
how the effects of advertising is distributed over time. (To access a discussion of Ad Stock, click
here Ad Stock).
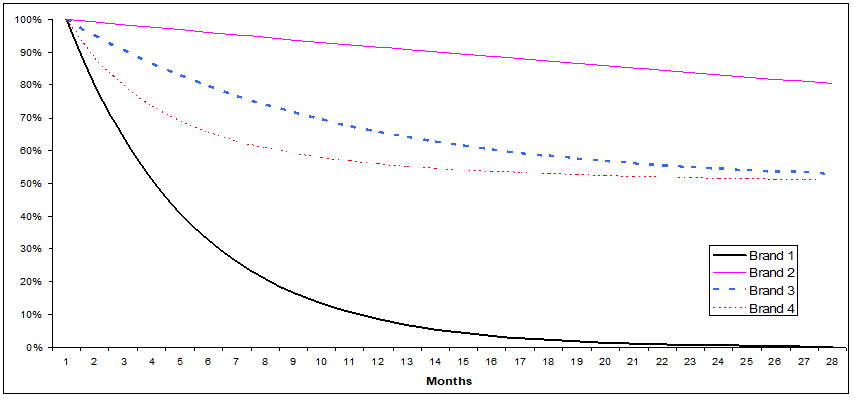
Similar to ad stock is the element of baseline decay. Baseline decay is simply how well would sales
for a product do if the company stopped all advertising and marketing. If a product is going to be in a grocery
shelf anyway, and if it is the least expensive item on that shelf, likely it
will continue to do well with or without advertising, with very little
decay. Same for an iconic brand or one
with a very loyal customer base. But new
products, or more expensive products likely would decay quickly without
advertising/marketing support. The graph
below shows 4 examples of actual decay curves in Marketing Mix Models I’ve
worked on.
The results of Marketing Mix Models are usually some ROI
measures. For example, TV might have an average ROI of “2.3” which means you
get on average $2.30 dollars of sales for every dollar you spend on TV. However, presenting ROI that way gives people
the impression that the effects of adding a dollar more of any media or
marketing is a straight line. It isn’t,
it is a curve (often a complex curve, see the next two graphs below).
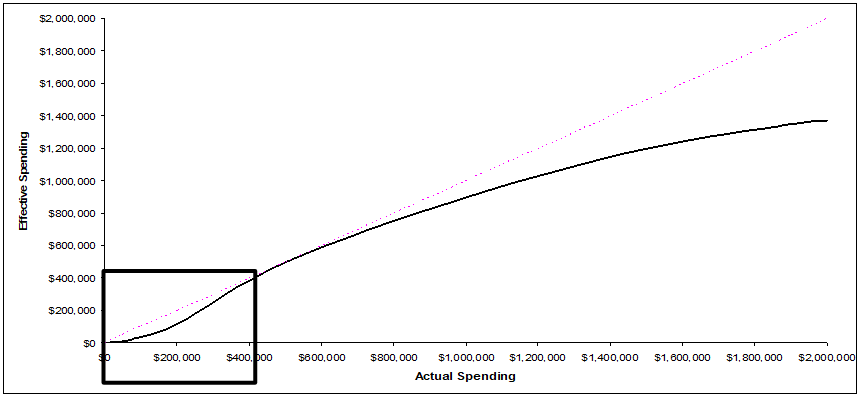
For one, almost all advertising and marketing have a
“Threshold Level”. In other words, you
need to spend at least a given amount on that advertising before it starts
working well. This might be because
very cheap advertising buys are rarely cost effective. Yes, you can spend very little and put an ad
on a little watched network at 3AM, but it costs so little because the audience
is very small and not very engaged. It
might also be a function of “reach and frequency”, it is generally believed
that if a person sees an ad 3 times they remember it far better than seeing it
just once (much more than 3 times better).
But Marketing Mix Modeling doesn’t really answer “why” threshold levels
exist, we just have statistical evidence that they do in almost every
case. The below graph shows the
threshold levels I was able to detect for one marketing factor in one Marketing
Mix Model I created.
While threshold levels likely exist for every media and
product, they are rarely put in Marketing Mix Models. For one thing, most large
advertisers rarely spend less than the threshold level. Without historical examples, we can’t calculate
threshold levels. And if future
advertising never spends below the threshold levels there is no need to model
the threshold levels.
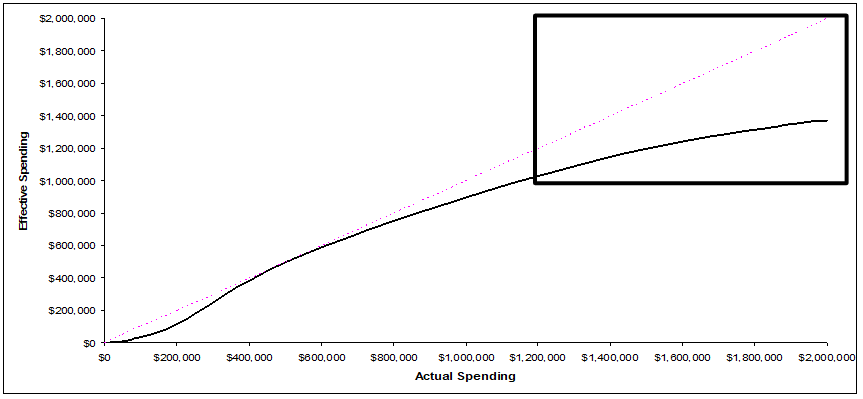
But at the other end of the graph above, we also have
“diminishing returns”. Once you spend
enough to get past the threshold level every incremental dollar you spend gets
less and less effective. Eventually (in
theory) if you spend enough money you will reach a point that spending more
money gets you no extra sales. Rarely
do advertisers reach the point of no effect, but often they reach the point in
spending where every dollar spent in a specific media gets them less than a
dollar back in sales (a waste of money at that point).
Unlike threshold levels most companies have lots of history
of spending spikes that help us calculate “diminishing returns”. And so most marketing mix models need to
include some way to calculate these diminishing returns.
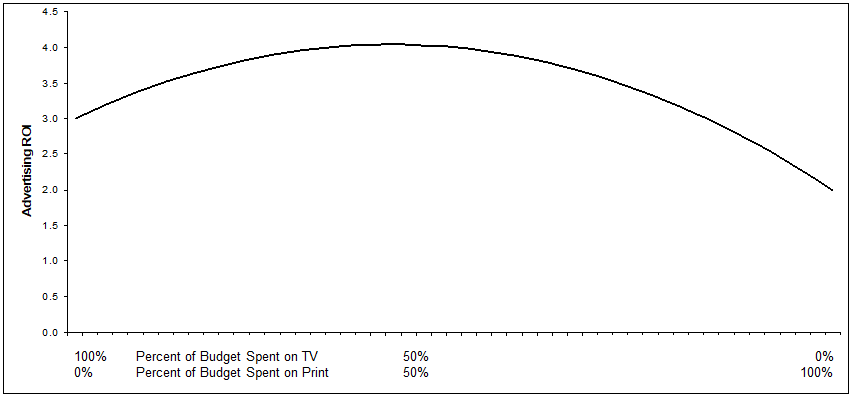
Another very important factor in marketing mix models is
“synergy”. By this I mean TV might do
well, Print might do well, but a mix of TV and Print does better per dollar
than doing TV or Print alone (see the graph below). A truth is that is there is at least some
synergy between every pair of marketing or advertising factor. In other words, having lots of different
marketing and media options always does better than focusing on only one or
two.
There are lots of examples out there of companies who
decided that “spot TV” or “Digital banners” were their most cost effective
media, so to save money they decided to put their entire marketing budget in
that one most effective media. In every
case I’ve seen, this has terrible results.
Not only do these experiments get above the point of diminishing returns
on that “most effective” media, but the client loses all the synergy effects of
the other media. The result is less
sales rather than more.
But synergy could be a minor factor or a major one. Coupons usually do wonderfully when there is
synergy with an awareness media (like TV) but do poorly without that
support. On the other hand, print and TV
synergies are usually minor. And if you
have a model with 10 media factors, you would need to calculate 45 synergy
effects to catch them all. So often in
marketing mix models you don’t calculate all the synergies, but only include
the synergies that you can calculate, and that you need to calculate due to
possible changes in future spending.
There are lots of non-linear effects that I haven’t
mentioned yet (and are rarely used in models). For example, reach and frequency
patterns might be important. Studies
have shown that people are more effected by the 3 viewing of an ad then by the
first, but the effects of additional frequency diminishes by the 20th
viewing etc. On the other hand, having a
break in frequency (a period of a month without seeing the same ad for
example), often “revitalizes” the effectiveness of a repeat viewing of the ad.
Rarely is these time series effects added to a marketing mix models. But if the
client wants to use the model to test flighting strategies, then these time
series effects can be calculated and included.
The art of marketing mix models is to focus on what things
the client is likely to change about their advertising and what history they
have that will allow you to calculate non-linear effects. Then to create a model with enough of these
complications so that the model dose what the client needs but doesn’t get
overloaded with complications that have limited use and effects. It is balance.

![]()
Phone: 212-529-5337
Voice Mail: 917-838-7966
Email: Rawley.Cooper@AnalyticForensics.com
Address: 23 East Tenth Street #304
New York City, NY 10003