
![]()
“Driver Model” is a technique I invented that was very
popular at Nielsen. Clients would pay
from $100,000 to $250,000 for a driver model unique to their category. These models would quantify for their
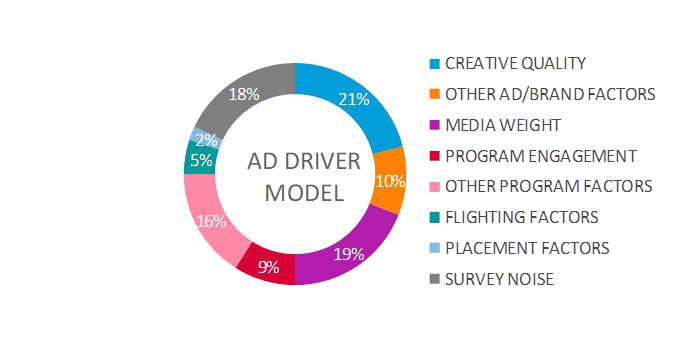
category what factors contributed to some aspect of advertising recall (see the
pie chart below, the pie is the “main” output from a driver model).
Clearly Ad Recall is a very complex phenomenon, highly
non-linear and difficult to model. And I
spent a lot of time at Nielsen creating very accurate models that predicted
it. But while accurate since they were
highly non-linear, they were also very difficult to use or understand and so
didn’t get used much. Then I came up
with the idea to do something less accurate but a lot more linear (so it could
be easily translated into the above pie) and that became very useful and so
very popular.
The methodology is very much like econometric modeling
(like marketing mix models). Like
econometric models, we take a very complex system and force it into a linear
model (with some non-linear elements) to simplify it.
But there are two differences between an ad driver model
and an econometric model: Econometric
models are predicting a continuous function, so LS regressions (or similar
techniques) are used. Ad recall is
basically a probability so we start with logistic regressions.
The second difference is that econometric models have lots
of uses, isolating factors, predicting the future, optimizing, etc. So, accuracy is important and many time
series and non-linear factors are needed.
But with driver models, we only need them to isolate and quantify
factors. So we sacrifice accuracy to
keep it as linear as possible.
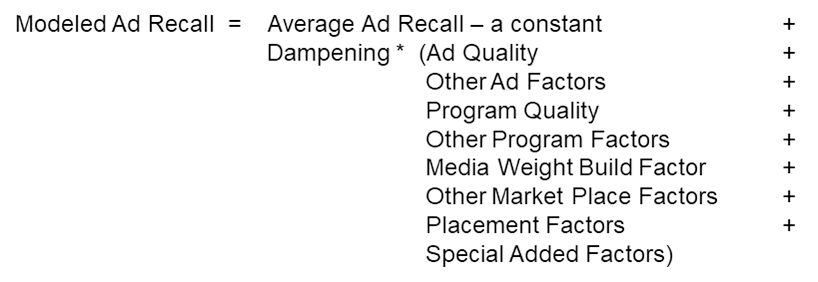
Since these models are based on logistic regressions, we
can’t remove all non-linear factors. So
we include a “dampening” factor in the model (see equation below). Why damping is important is that ads that
have very high recall to start with, it is very hard to make it more memorable
(they are already near 100%). But highly
memorable ads are also very hard to make less memorable (they stick in your
head no matter what). Some problem exists
with very bad ads, very little you can do to make them more
or less memorable. But average
ads are very easy to make memorable just by putting them on a better show,
making minor improvements to the creative, or just putting them at the
beginning of the pod.
So this dynamic is
reflected by a dampening factor (a number that ranges from about 30% to
100%). Ads that are very memorable or un-memorable
will have a dampening factor near 50% and every factor will be less effective.
But ads with average memorability with have a dampening of near 100% (almost no
dampening at all).
Now this sounds reasonably simple: pull all the data, put it in a logistic
regression, translate it into a linear model with a dampening factor, and you
are done. It is a LOT harder to force a
very complex non-linear dynamic into a linear form (“kicking and screaming” all
the way). The final models are not very
accurate, but they are accurate enough and very useful.
Not only can you create the pie chart at the top (which
changes for every category), but you can answer a lot of detailed questions
that would be impossible without the driver model structure to start with. For example, we all know that 30 second ads
are more memorable then 15 second, but how much more memorable? Once you find and quantify all the bigger
factors (like creative quality), it is possible to then quantify the smaller
factors (like pod position or ad length).

![]()
Phone: 212-529-5337
Voice Mail: 917-838-7966
Email: Rawley.Cooper@AnalyticForensics.com
Address: 23 East Tenth Street #304
New York City, NY 10003